import numpy as np
import pandas as pd
import matplotlib.pyplot as plt
import seaborn as sb
포켓몬데이터가 있다.
| id | species | generation_id | height | weight | base_ experience |
type_1 | type_2 | |
| 0 | 1 | bulbasaur | 1 | 0.7 | 6.9 | 64 | grass | poison |
| 1 | 2 | ivysaur | 1 | 1.0 | 13.0 | 142 | grass | poison |
| 2 | 3 | venusaur | 1 | 2.0 | 100.0 | 236 | grass | poison |
| 3 | 4 | charmander | 1 | 0.6 | 8.5 | 62 | fire | NaN |
| 4 | 5 | charmeleon | 1 | 1.1 | 19.0 | 142 | fire | NaN |
| ... | ... | ... | ... | ... | ... | ... | ... | ... |
| 802 | 803 | poipole | 7 | 0.6 | 1.8 | 189 | poison | NaN |
| 803 | 804 | naganadel | 7 | 3.6 | 150.0 | 243 | poison | dragon |
| 804 | 805 | stakataka | 7 | 5.5 | 820.0 | 257 | rock | steel |
| 805 | 806 | blacephalon | 7 | 1.8 | 13.0 | 257 | fire | ghost |
| 806 | 807 | zeraora | 7 | 1.5 | 44.5 | 270 | electric | NaN |
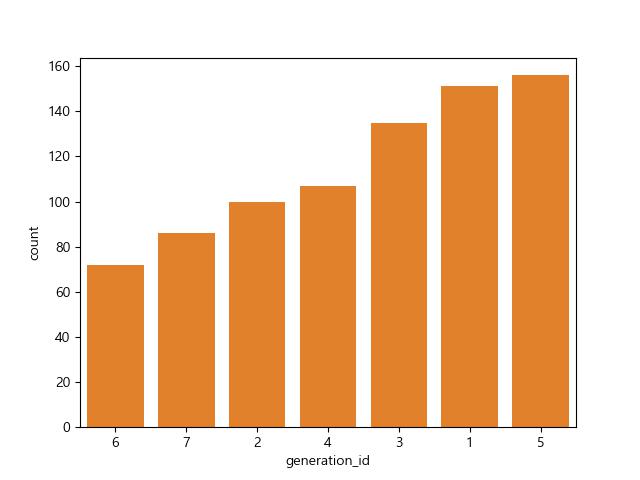
df['generation_id'].value_counts()
generation_id
5    156
1    151
3    135
4    107
2    100
7     86
6     72
Name: count, dtype: int64
특정 컬럼이 카테고리컬 데이터일때, 각 value 별로 몇개씩 있는지를 차트로 한번에 나타내고 싶을때
seaborn의 countplot 함수 사용한다.
sb.countplot(data = df,x='generation_id')
plt.show()

sb.color_palette()

base_color= sb.color_palette()[1] #주황색
sb.countplot(data = df,x='generation_id', color = base_color)
plt.show()

정렬하기 (오름차순)
base_order = df['generation_id'].value_counts().index
sb.countplot(data = df,x='generation_id', color = base_color, order= base_order)
plt.show()

정렬하기 (내림차순)
reverse_order = base_order[ : : -1]
sb.countplot(data = df,x='generation_id', color = base_color, order= reverse_order)
plt.show()

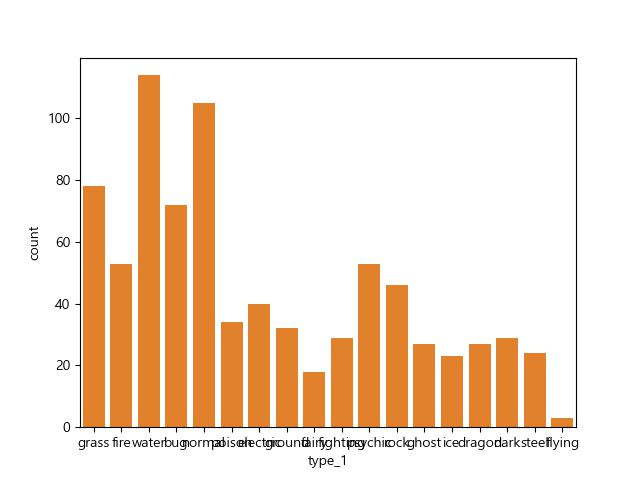
df['type_1'] 데이터로 그래프를 그려보도록 하자
sb.countplot(data = df,x='type_1', color = base_color)
plt.savefig('four.jpg')
plt.show()

정렬하고, xticks 각도 변경하기
base_order = df['type_1'].value_counts().index
sb.countplot(data=df, x='type_1', color=base_color, order=base_order)
plt.xticks(rotation=60) # 기울기를 60도로 한다
plt.savefig('five.png')
plt.show()

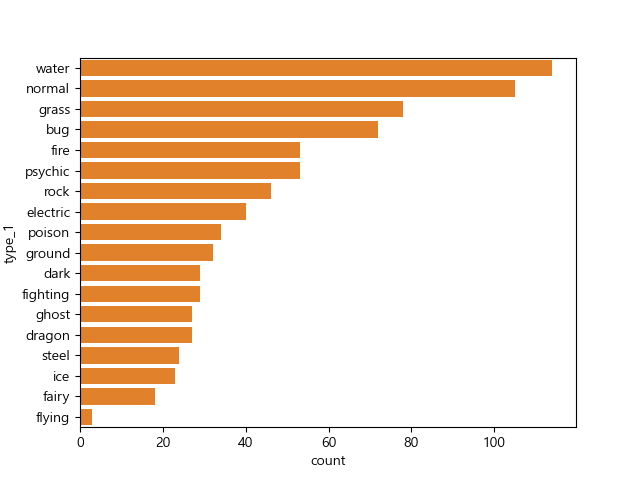
x축을 y축으로 바꾸기
sb.countplot(data=df, y='type_1', color=base_color, order=base_order)
plt.show()

'Python > Matplotlib' 카테고리의 다른 글
| scatter, histogram 등의 차트를 스트림릿(streamlit)으로 표현하기 (0) | 2024.04.26 |
|---|---|
| Matplotlib) Scatter(스캐터) 차트와 HeatMap(히트맵) 그리기 (0) | 2024.04.16 |
| Matplotlib) Histograms(히스토그램) 차트 그리기 (0) | 2024.04.15 |
| Matplotlib) Pie (파이) 차트 그리기 (0) | 2024.04.15 |
| Matplotlib) 그래프 디자인 변경 시 사용하는 함수 알아보기 (0) | 2024.04.09 |