데이터를 퍼센테이지로 비교해서 보고싶을때 Pie chart(파이 차트)를 사용한다
포켓몬 데이터를 이용하여 Pie chart를 그려보자
df
| id | species | generation_id | height | weight | base_ experience |
type_1 | type_2 | |
| 0 | 1 | bulbasaur | 1 | 0.7 | 6.9 | 64 | grass | poison |
| 1 | 2 | ivysaur | 1 | 1.0 | 13.0 | 142 | grass | poison |
| 2 | 3 | venusaur | 1 | 2.0 | 100.0 | 236 | grass | poison |
| 3 | 4 | charmander | 1 | 0.6 | 8.5 | 62 | fire | NaN |
| 4 | 5 | charmeleon | 1 | 1.1 | 19.0 | 142 | fire | NaN |
| ... | ... | ... | ... | ... | ... | ... | ... | ... |
| 802 | 803 | poipole | 7 | 0.6 | 1.8 | 189 | poison | NaN |
| 803 | 804 | naganadel | 7 | 3.6 | 150.0 | 243 | poison | dragon |
| 804 | 805 | stakataka | 7 | 5.5 | 820.0 | 257 | rock | steel |
| 805 | 806 | blacephalon | 7 | 1.8 | 13.0 | 257 | fire | ghost |
| 806 | 807 | zeraora | 7 | 1.5 | 44.5 | 270 | electric | NaN |
df2 = df['generation_id'].value_counts()
df2
generation_id
5    156
1    151
3    135
4    107
2    100
7     86
6     72
Name: count, dtype: int64
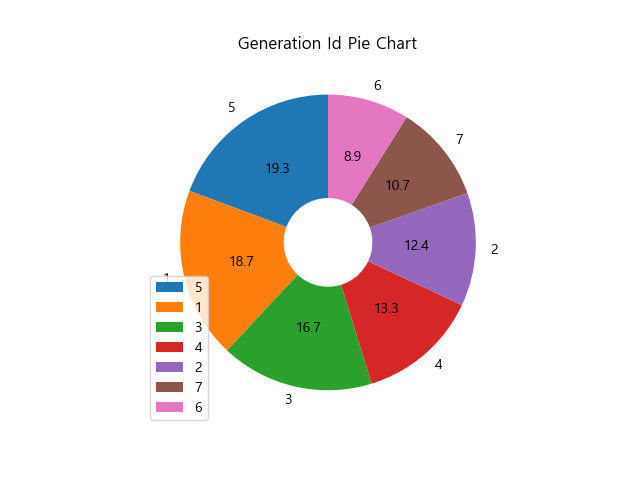
plt.pie(df2, labels= df2.index , autopct='%.1f' , startangle=90, wedgeprops={'width':0.7} )
plt.title('Generation Id Pie Chart')
plt.legend()    # 범례를 나타내준다
plt.show()
labels= df2.index는 인덱스를 라벨로 표현해준다
autopct='%.1f'는 소숫점 1자리까지 표현해준다 숫자를 변경하여 응용가능하다
startangle라는 매개변수를 지정해서 시작 각도를 변경할 수 있다
wedgeprops라는 매개변수는 가운데에 구멍을 뚫은 디자인을 나타내어준다
----------------------------------------------------------------------------------------------------------------
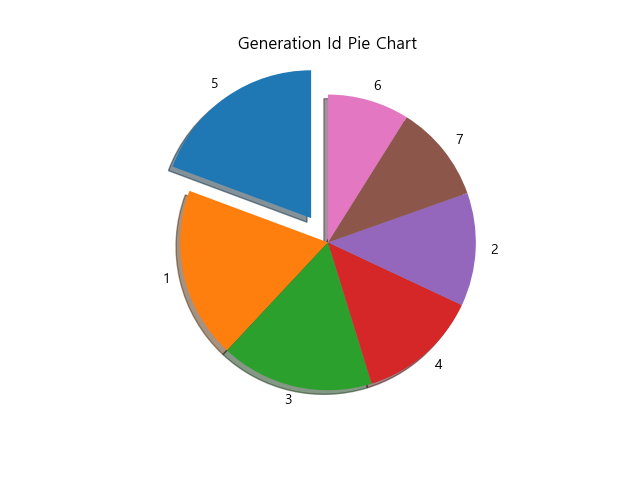
myexplode = [0.2,0,0,0,0,0,0]

plt.pie(df2, labels= df2.index, startangle=90, explode = myexplode, shadow = True)
plt.title('Generation Id Pie Chart')
plt.show()
explode라는 매개변수를 지정해서 그래프중 하나를 강조할 수 있다
shadow = True 로 그림자를 추가할 수 있다
'Python > Matplotlib' 카테고리의 다른 글
| scatter, histogram 등의 차트를 스트림릿(streamlit)으로 표현하기 (0) | 2024.04.26 |
|---|---|
| Matplotlib) Scatter(스캐터) 차트와 HeatMap(히트맵) 그리기 (0) | 2024.04.16 |
| Matplotlib) Histograms(히스토그램) 차트 그리기 (0) | 2024.04.15 |
| Matplotlib) Bar chart : countplot 차트 그리기 (0) | 2024.04.15 |
| Matplotlib) 그래프 디자인 변경 시 사용하는 함수 알아보기 (0) | 2024.04.09 |